James SmithinTowards Data ScienceHow to Automate your Online Prints Business with Etsy & ProdigiPart 1/2: how to create orders using Python and the Etsy + Prodigi APIs·6 min read·Apr 16, 2021----
James SmithRunning a Data Community (and knowing it was time to step down..)Here I list out my experiences & the pros and cons of co-running #sportsvizsunday·5 min read·Oct 27, 2020----
James SmithinTowards Data ScienceShould Vettel be considered an F1 great and was his time at Ferrari a failure?A visual analysis of Sebastian Vettel’s career in numbers and charts.·12 min read·Jun 4, 2020--1--1
James SmithinNightingaleFormula 1 2020: Sports Viz Sunday Data ChallengeA preview of three F1 datasets and questions to get you started in the March Sports Viz Sunday challenge!·5 min read·Mar 2, 2020----
James SmithinAnalytics VidhyaHow to create Football Pitches/Goals as Backgrounds in TableauA step by step guide on how to make a pitch map in Tableau, featuring some ideas for use cases.·5 min read·Feb 5, 2020--1--1
James SmithinNightingaleHow Data Visualization Could Change Football On and Off the FieldVisually analysing direct set pieces in football using StatsBomb Data, R, and Tableau·14 min read·Jan 17, 2020--1--1
James SmithDecoding Encode 2019A summary of the key themes from the Encode Conference exploring data journeys in design, journalism & education.·8 min read·Jan 14, 2020----
James SmithinNightingaleThere’s No Verstappen Me Now! How the Flying Dutchman Stacks Up After 100 Formula 1 Races.A close look at the stats and trends behind Max Verstappen’s impressive young F1 career·12 min read·Nov 11, 2019----
James SmithinNightingale12 Lessons In My Journey From Tableau Amateur To AmbassadorMy story of using Tableau Public and the impact it has had on my life & career. Packed with learnings, tips & poor jokes!·10 min read·Aug 15, 2019--1--1
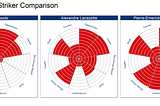
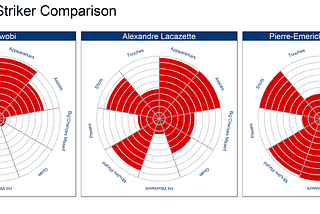
James SmithinTowards Data ScienceA History of Polar Area / Coxcomb / Rose charts & how to make them in R’s ggplot2.A discussion of the History of the Polar Area Chart and a tutorial on how to create them in R’s ggplot2.·6 min read·Aug 12, 2019--1--1